Screen tones
Home Computer Camera Lab Colour Space Post-Processing Tutorials WoW Albums Waffle Index


Return

Photo of a Wedge

One of the concepts of Ansel's Zone System is pre-visualisation - how a real-life object will be rendered (in B&W) in a print.  Nowadays we will first see this on the screen.  So can I predict/visualise what the camera will show?

I tried a number of shots/situations, but I think the following captures the essence of what I found.

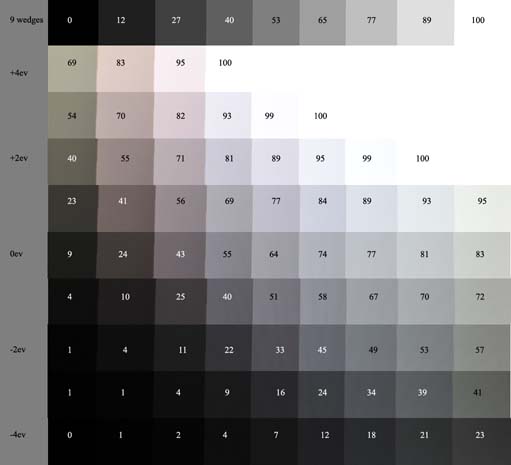
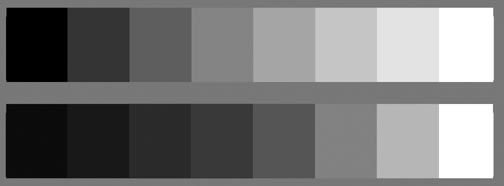
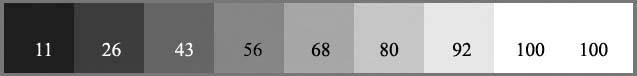
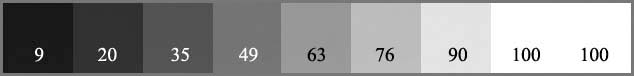
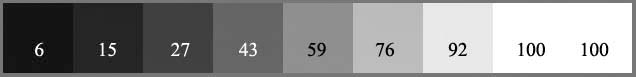
As an experiment, I created a 9 equal step wedge (generated in Photoshop), displayed it on a not very good LCD un-calibrated screen and photographed it!  This was hardly a contrast image and so well within the limits of the camera's dynamic range and by adjusting exposures I should be able to work out what the image will look like.

Here are the 9 renditions of the wedge (the top line is the original, not an image) by taking a bracket series of photos.  I've shown the L value of each wedge.

And this is a plot of these exposures


If I take the 0ev exposure and apply Auto-Levels to it (actually my PS action of 3 auto-levels, one on each channel) to maximise the contrast and compare that to the original image, then one can see that the whole image has been lightened quite dramatically.


From this experiment, I think I can safely say that there is no way one can predict how the screen tone values of the image will turn out!

But why are these wedges not equally spread out?  Each is one f-stop different and I have read that

The gamma encoded gradient distributes the tones roughly evenly across the entire range ("perceptually uniform"). This also ensures that subsequent image editing, colour and histograms are all based on natural, perceptually uniform tones.

Gamma

So I thought to do a wee experiment using my camera's spot meter to measure the light on an LCD screen for the following...
a) I created a new image document and filled it with Black
b) I added a layer and filled it with White
c) I varied the Opacity of the top layer to change the brightness of the image in 1/3rd ev steps

So I had the full screen's dynamic range and how it varied by f/stops.

Using the White exposure as 0 ev, I plotted the Lab L values as I reduced the Opacity towards Black. I then did this again as I increase the Opacity and took the average of the two readings.

Opposite is the resultant plot - reflecting that measuring the change at the dark end was not very satisfactory.

This is a real surprise. I checked it on another screen and got similar results.
What is going on?  I'm pretty sure this is effectively measuring Gamma.

This excellent page UNDERSTANDING GAMMA CORRECTION explains all.

To try and answer the tone band problem, I then constructed the following two strips...

The top one is 8 equal tones and the bottom one follows the ev exposures from the above plot.

As you can see they are completely different.


I then shot a 9 step +/-1 ev bracket of this image, and then stacked them together for easy comparison.

In the following snapshot, each of the steps are 1 ev different from the previous one. The Equal tones are on the left of the image.  I have placed some marks for approximate equal L values.

It is clear that if we use equal tonal steps there is no obvious relationship to f/ stops.

The equal tones spread out the shadow detail, but loose the highlights, whereas the ev tones are consistent, but shadow detail is easily lost - although how much is lost does depend on the scale of the object being viewed.

'Film'

The camera settings effective change the 'film' characteristics - so I need to standardise on one for the rest of the experiments.  I should really use Raw, but this adds an extra step in post-processing, so I will try jpgs for now and only use Raw when I need extra insurance.

Here are three strips with Picture Control set of Neutral and Active D-Lighting as...

High
Auto
Off

I shall standardise on OFF (as my base 'film' type) at 200 ISO.

But I digress - I need to get back to Zones...

Next Page

Incidentally, while I was testing exposures, I also tried different lenses.  It was quite incredible how much better a prime was compared to a zoom lens - obvious really, but I had never done a proper comparison before - well worth using a prime if possible.  Also I had thought that a Polaroid filter behaved differently with a digital sensor and was not that effective, but it is well worth using.

I found a bug/feature with the D700 Live-View and through sitting down and really exercising the cameras, I learnt some attributes that were not in the manuals - a real gain by just 'playing' with them.

I also read that in the "old days" of digital processing, the built-in tone curves in Nikon cameras were much "flatter" (like the linear tone curve) and much more "accurate," without the tonal shifts, brightness adjustments and aggressive S curves that you are now seeing with the "default" curves in the D3 and D700. The reality is that these "flat" tone curves didn't look pleasing right out of the camera, which made post-processing necessary for almost every image in order to make it look pleasing to the eye.  Nikon has incorporated years of experience into the "new" tone curves, automatically applying many of the "corrections" that used to be required in order to produce a pleasing image.

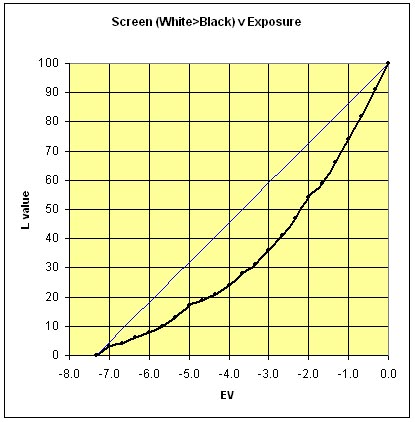
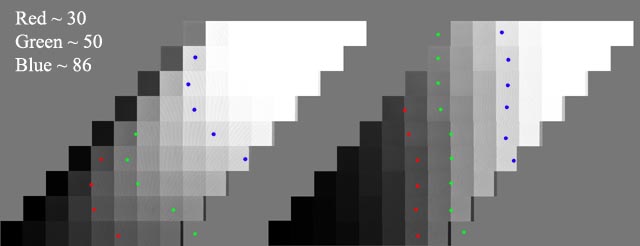
They say that if your goal is to correctly render the mid-tone at 50% L Lab, you will need adjust the midpoint in post processing, or expose with -0.3/0.5 exposure compensation. (The EV exposure compensation will then correctly place the mid-tone, but still implements the "tonal shift" of mid-tones in relation to other tones in the image.)

'Twas much simpler (?) in the film days!